I often check Seattle AQI readings across different apps, especially when wildfire smoke appears in the forecast. Air quality can change quickly throughout the day, so knowing which numbers to trust matters when deciding whether to open windows, spend time outdoors, or move practice indoors.
TL;DR Quick Answers
aqi Seattle
Seattle AQI readings differ between apps because each one reads different sensors, averages different hours, scores different pollutants, or uses a different scale. Make decisions with EPA’s AirNow, watch a corrected sensor map for early smoke warning, and remember that no app can see the air inside your home.
Official reading: EPA’s AirNow, built on regulatory monitors and the NowCast average.
Early warning: The Puget Sound Clean Air Agency sensor map, which shows EPA-corrected PurpleAir data.
“Good” cutoff: PM2.5 at or below 9.0 µg/m³ since May 2024.
Seattle wrinkle: Washington retired its stricter WAQA scale in 2022, so older pages still cite outdated thresholds.
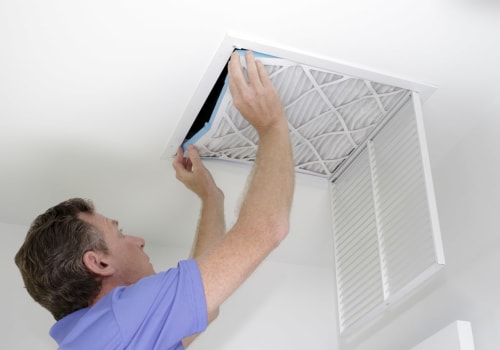
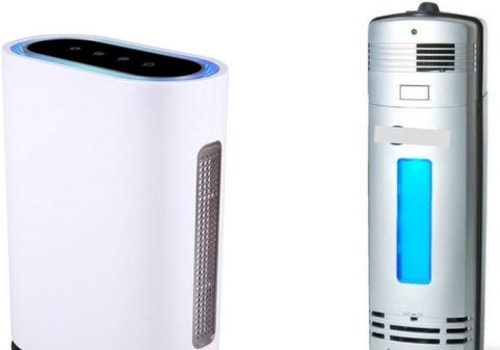
Indoor air: When readings climb, close the windows, run a HEPA cleaner, and use the highest MERV filter your system handles.
Top Takeaways
Neither app is broken: Seattle AQI apps differ because of their source, time window, pollutant, and scale.
AirNow for decisions: Its NowCast follows EPA's method and matches local health guidance.
Sensors for early warning: A corrected sensor map catches arriving smoke before the NowCast moves.
Check the scale: The PM2.5 Good range has topped out at 9.0 since May 2024, and Google's scale runs backward.
Look indoors too: Every app reports outdoor air, so close up and filter when readings climb.
Why Two Seattle AQI Readings Rarely Match
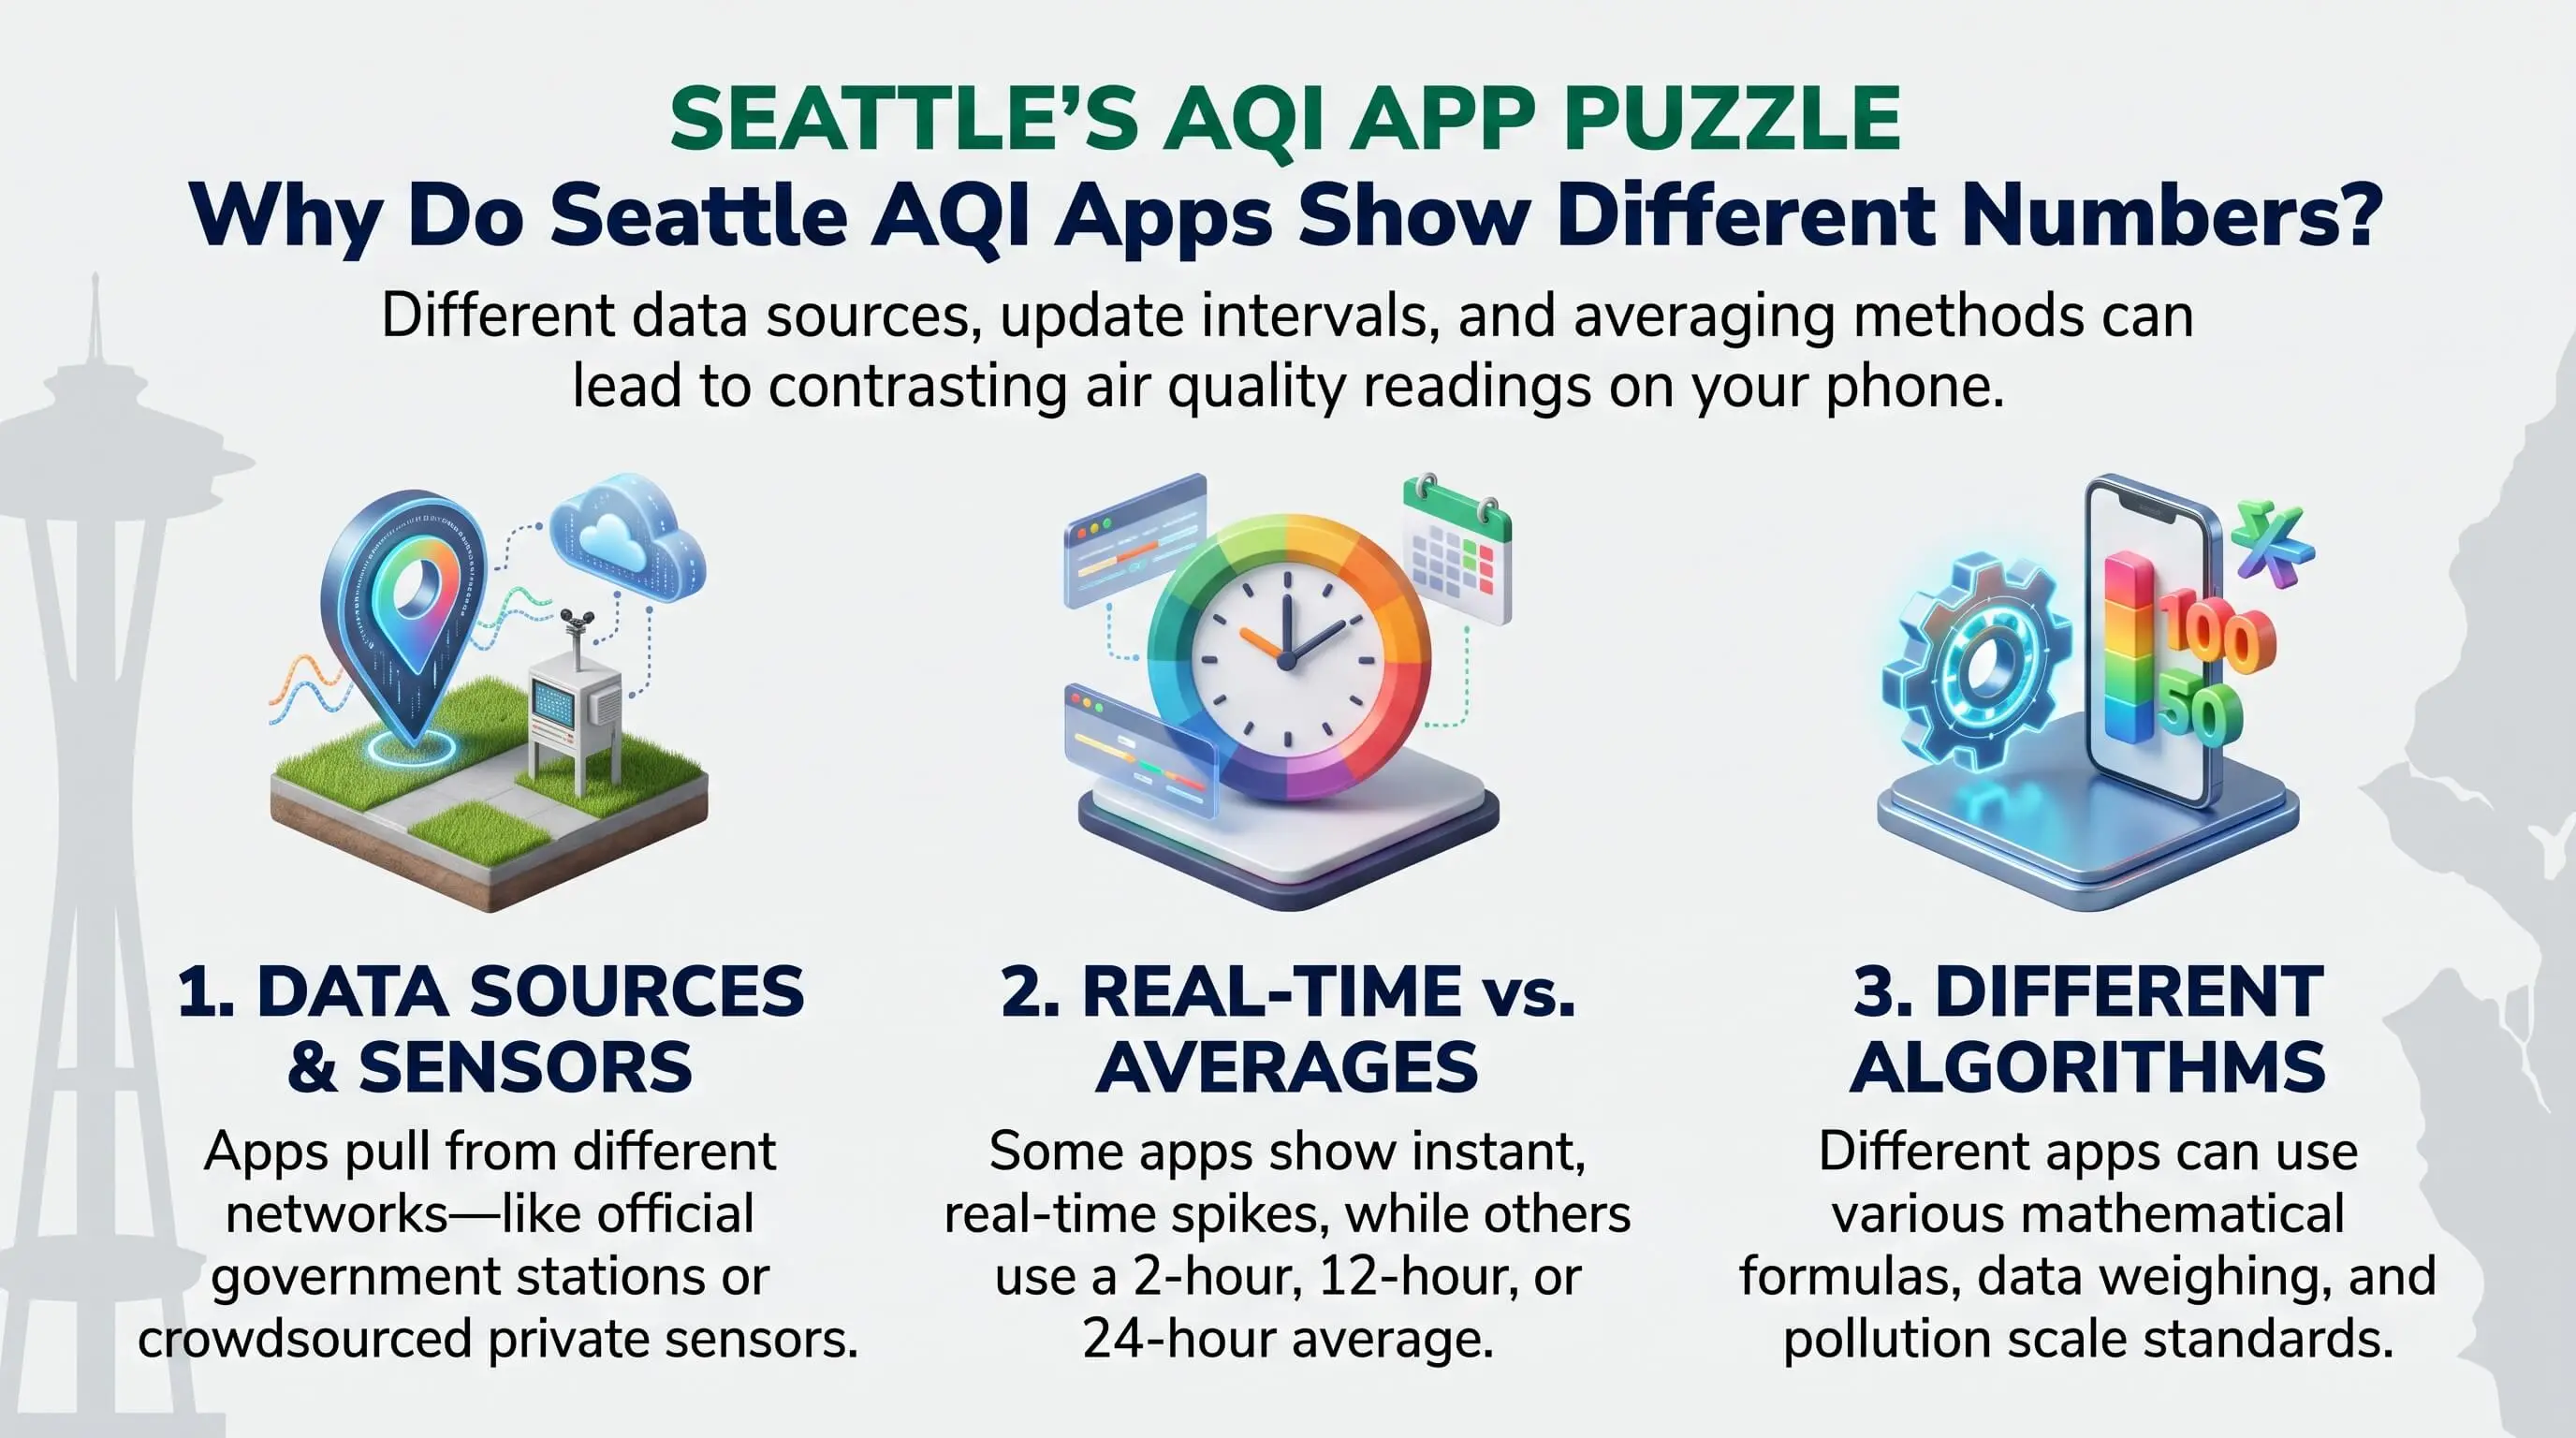
Every app starts with the same idea. An air quality index converts a pollutant concentration into one score, and the U.S. version runs from 0 to 500. From there, each app picks its own route to the final number, and four choices explain nearly every disagreement you'll run into.
They Read Different Sources
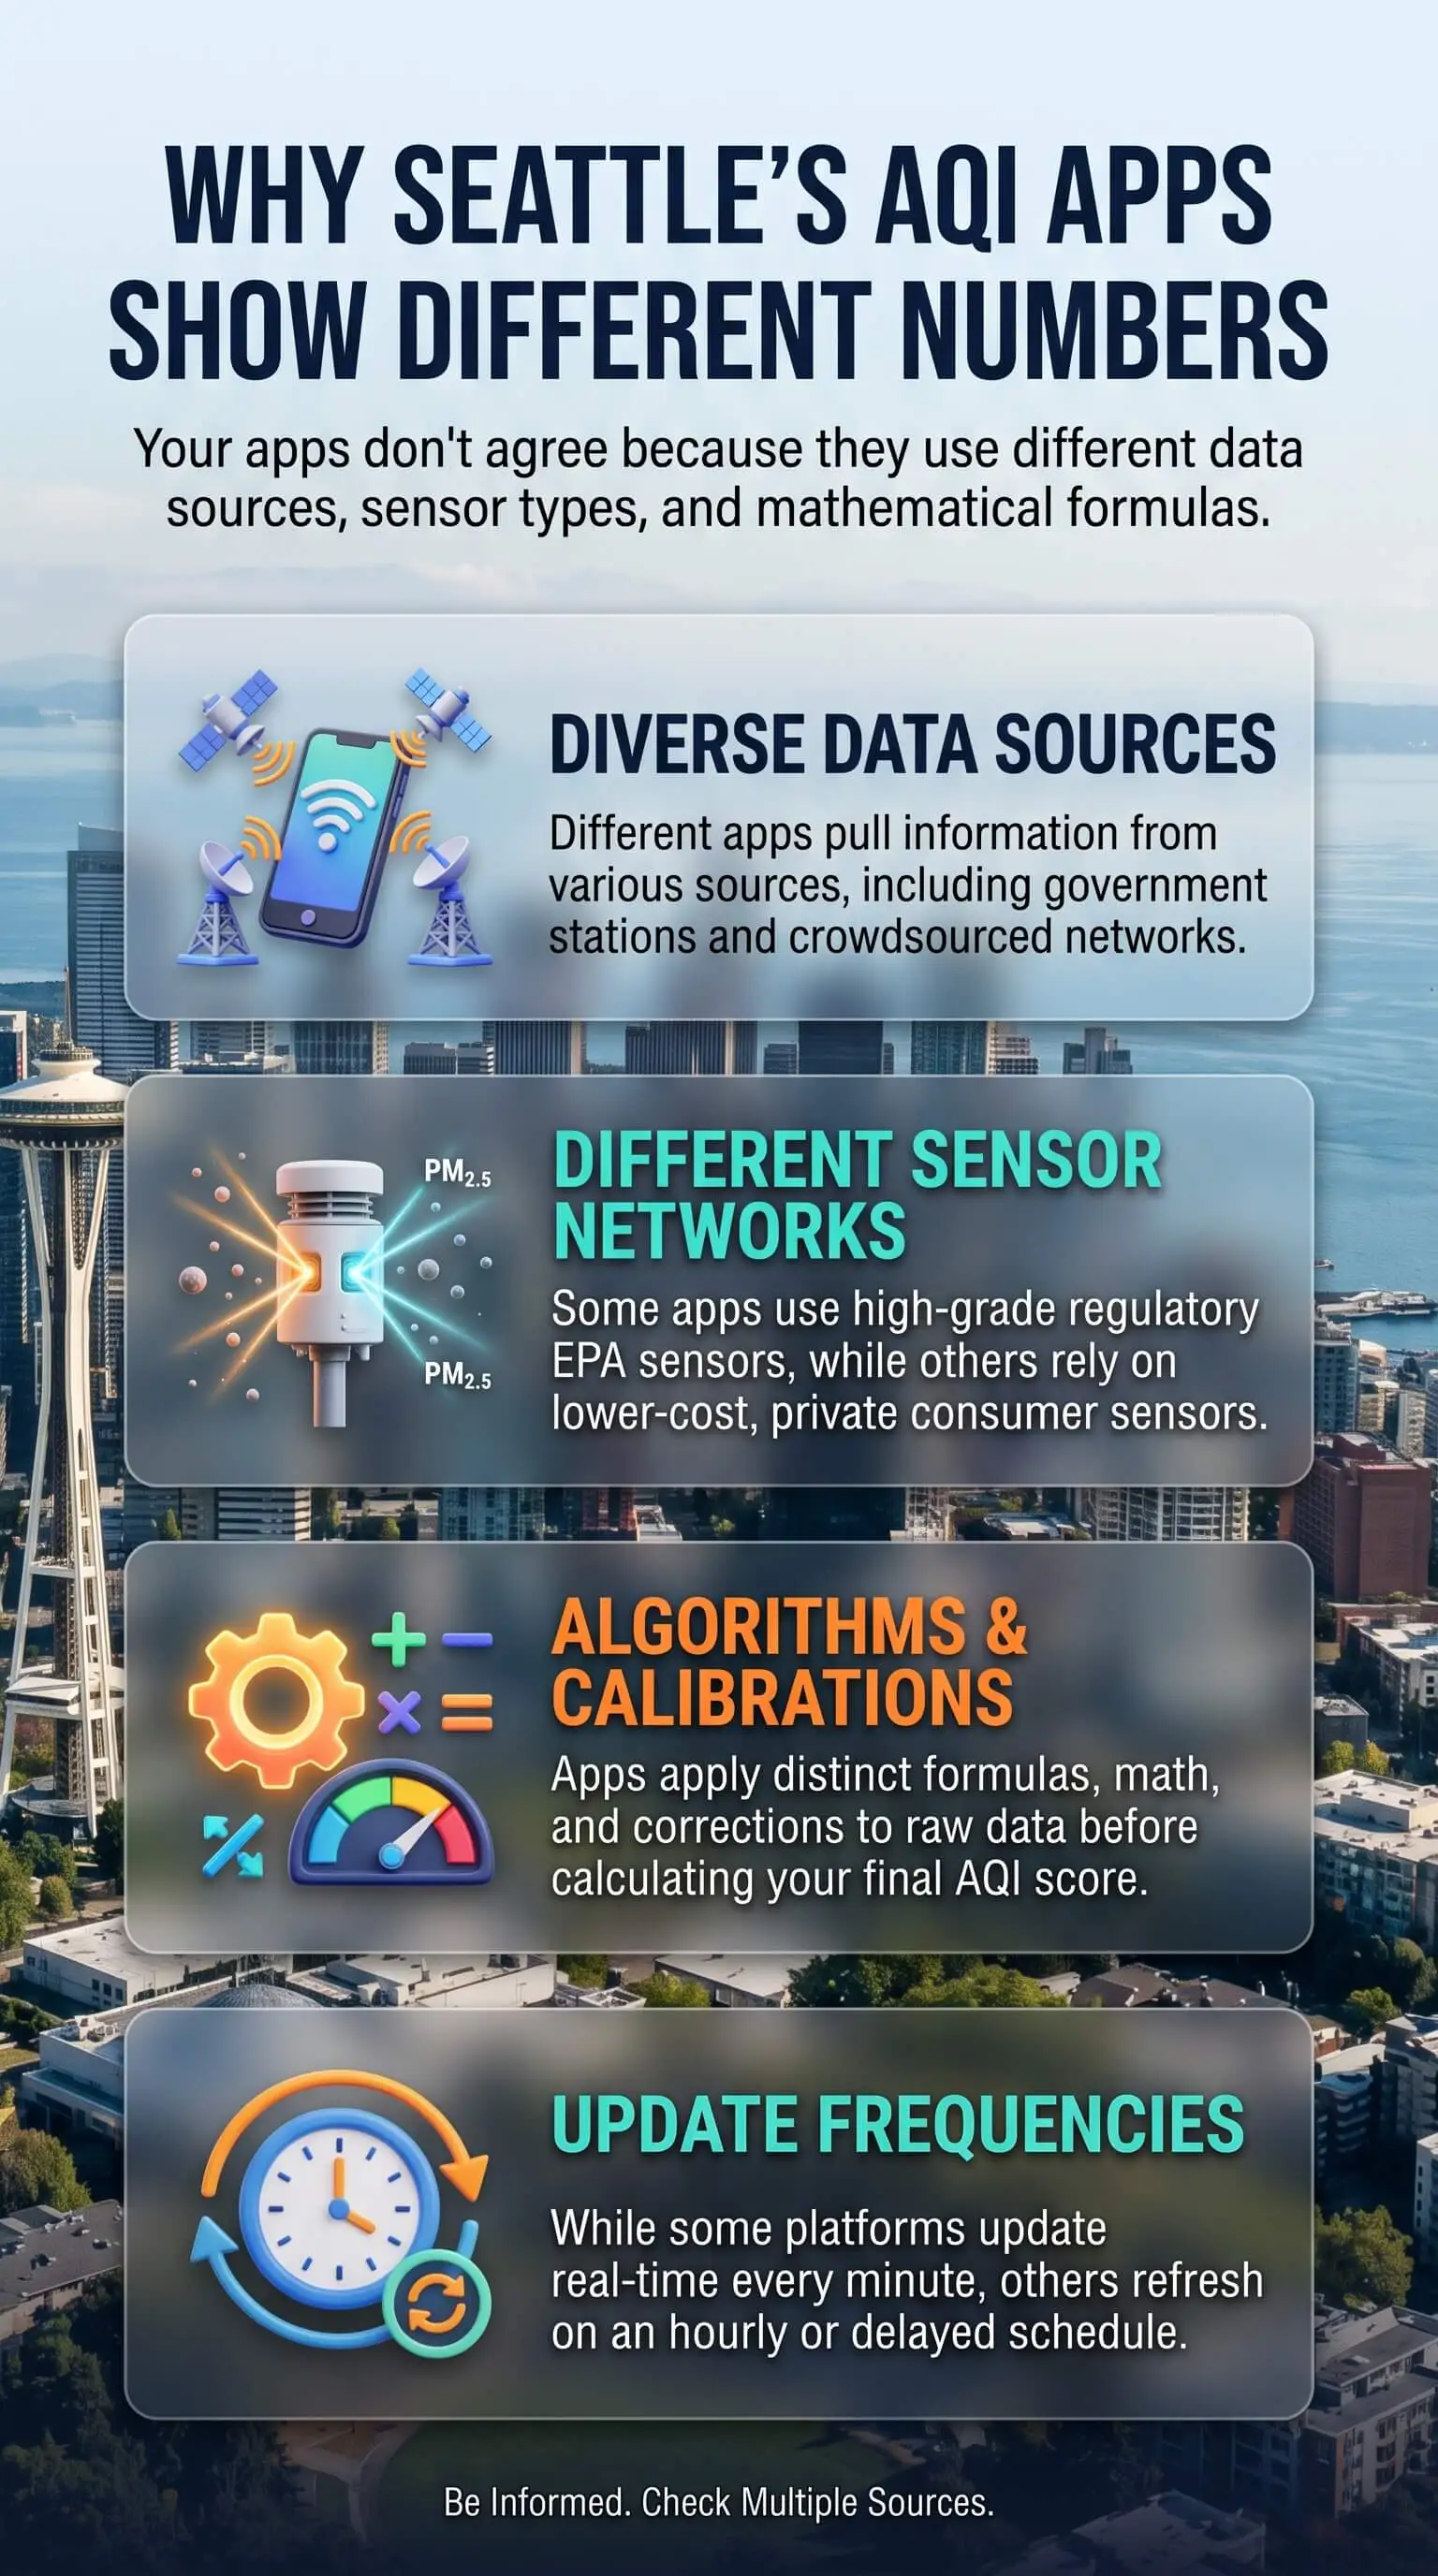
State and local agencies run the regulatory monitors behind official readings, and EPA collects that data through AirNow. PurpleAir and similar low-cost sensors sit on porches and rooftops across the city, counting particles with a laser. Plenty of weather apps skip monitors altogether and show a modeled estimate for a grid square. Apple lists BreezoMeter as its U.S. air quality provider, for example, so the number in Apple Weather comes from a model. Raw sensor data also needs a correction before it lines up with official monitors. That's why the Puget Sound Clean Air Agency runs PurpleAir readings through an EPA correction before it posts them on its map.
They Average Different Hours
AirNow reports particle pollution with the NowCast, a weighted average of recent hours that leans harder on the newest data when conditions shift. Some apps show only the latest hour. Sensor maps go further and can show a 10-minute or even one-minute reading. So when smoke rolls in, the short-window app climbs first while the NowCast is still carrying cleaner overnight air. Once the smoke clears, the order flips.
They Score Different Pollutants
Your AQI equals the highest score among the pollutants a station measures. A full monitoring station can report ozone. A particle sensor only sees PM2.5, so on a hot afternoon, ozone can set the official number while your sensor app still glows green.
They Use Different Scales
EPA lowered the top of the PM2.5 Good range from 12.0 to 9.0 micrograms per cubic meter in May 2024. Any app still running the old breakpoints can call air green when AirNow calls it Moderate. Google's Universal AQI flips the scale entirely. On Google, 100 means the cleanest air, so a high score is good news.
What Makes Seattle Readings Split Wider
Inversions trap local pollution. In fall and winter, cool air settles under a warmer layer and holds wood smoke and traffic exhaust close to the ground. A low-lying neighborhood can read worse than a ridge a mile away. In a city with this much terrain, the closest sensor matters more than it would somewhere flat and windy.
Wildfire smoke arrives fast. Smoke from the Cascades, Eastern Washington, and British Columbia can fill the Puget Sound basin within hours. That's when NowCast lag matters most, and it's when apps disagree by the widest margin. Tracking smoke from the north? This guide to finding your town on a Canada wildfire smoke map shows you how to read the smoke layer before the AQI catches up.
One agency publishes two views. The Puget Sound Clean Air Agency sensor map offers a Health view and an Instant view, and both come from the same sensors. Health smooths the readings for decisions about exposure. Instant shows the latest minute, which helps when you're watching smoke move in.
Washington retired on its own scale. Until 2022, the state used the Washington Air Quality Advisory, which flagged health risk at lower particle levels than the federal AQI. The Departments of Ecology and Health switched to EPA's AQI by April 30, 2022. Some older school district and agency pages still describe the old system, though, so if a page mentions WAQA, its thresholds no longer apply.
Which Seattle AQI Reading Should You Trust?
I make decisions with AirNow. Its numbers come from regulatory monitors that follow EPA's method, and county health and school guidance uses that same scale. For early warning, I keep an eye on a corrected sensor map, because sensors catch arriving smoke before the NowCast moves. When the two disagree, I run five quick checks.
Check the pollutant. Confirm whether each app is scoring PM2.5 or ozone.
Check the time window. A one-minute or one-hour reading moves faster than the NowCast.
Check the scale. Make sure both apps use EPA's 0 to 500 scale and the 2024 breakpoints.
Watch the trend. A climbing sensor reading next to a flat AirNow number usually means the air is getting worse.
Act on the higher credible reading. Lean cautiously when a child, an older adult, or someone with asthma lives with you.
Pro Tip: Keep a live Seattle AQI map open beside AirNow, and you'll spot a widening gap at a glance. The same checks hold up on borderline days, and this guide to staying safe on a moderate AQI day covers what to adjust when the number sits between 51 and 100.
What the Outdoor Number Leaves Out
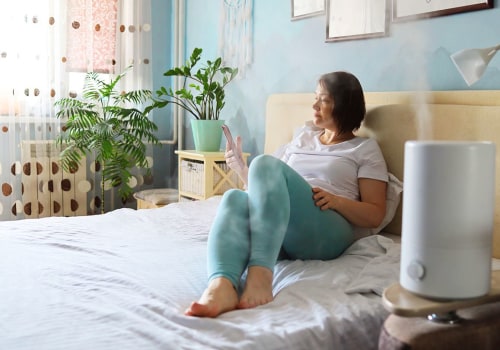
Don't take your indoor air for granted! AQI meaning helps explain outdoor air quality, but every app on your phone reports outdoor air, and not one of them can tell you what's happening inside your home, where you spend most of your day. Smoke slips in through gaps and open windows, and a large share of it stays. When readings climb, close up the house and run a HEPA air cleaner in the room where you sleep. Have a central system? Use the highest MERV filter it handles and set the fan to On.
"I've compared the two side by side on smoky mornings, and the corrected sensor map usually turns orange before AirNow does, because the NowCast is still averaging in the cleaner overnight hours. When that gap opens, I treat the sensor map as my warning and AirNow as my confirmation."
7 Essential Resources
See Live Seattle AQI Readings on One Map puts current Seattle readings next to a plain-language guide for each AQI level, plus filtration steps matched to the number on your screen.
Read Washington's Wildfire Smoke Guidance from the Department of Ecology links the statewide monitoring map and smoke forecast, with action steps for every AQI color.
Learn How to Read Low-Cost Sensor Data walks you through how sensors perform and why EPA wants their data corrected before you act on it.
Protect Higher-Risk Family Members From Smoke from the Washington Department of Health names who faces the most risk and how to cut exposure indoors and out.
Get King County's Smoke Day Checklist covers masks, cleaner indoor air, when to move activities inside, and how to sign up for county alerts.
See How Air Quality Forecasts Get Made from the National Weather Service shows how NOAA and EPA turn monitor data into the forecasts your apps display.
Know How Smoke Affects Your Body from the CDC lists who runs a higher risk and which symptoms deserve a closer look.
3 Statistics
9.0 micrograms: EPA lowered the top of the PM2.5 Good range from 12.0 to 9.0 micrograms per cubic meter, effective May 6, 2024. Source: Federal Register
About 2x: Uncalibrated PurpleAir sensors can read about twice as high during wildfire smoke, so the regional agency calibrates them before display. Source: Puget Sound Clean Air Agency
About 80%: In homes with typical air leakage and no central air, indoor PM2.5 can climb by about 80% of the outdoor increase during wildfire smoke, and by about 95% with the windows open. Source: Lawrence Berkeley National Laboratory
EPA air quality standards, differences in wildfire smoke sensor readings, and the amount of outdoor pollution entering homes highlight the importance of checking accurate AQI data and using high quality filters to reduce indoor particle exposure.
Final Thoughts and Opinion
I no longer treat a disagreement between apps as a problem to fix. When AirNow and a sensor map drift apart, the air is usually changing faster than an averaged number can follow, and that's the moment worth your attention. On steady days, the apps land close enough that any of them will do.
The habit I'd change is leaning on a single number. Pair the official reading with a corrected sensor map, look at which pollutant drives the score, and remember that none of it describes the air in your living room. Most people skip that last step, even though it's the one you control with a pleated furnace filter.
Frequently Asked Questions
Why does AirNow show a lower AQI than PurpleAir in Seattle?
Raw PurpleAir data often reads high in smoke, and a sensor map may show a short-window reading while AirNow uses the NowCast. For a fair comparison, pull up a map with EPA-corrected sensor data, such as the Puget Sound Clean Air Agency sensor map or the AirNow Fire and Smoke Map.
Which air quality app is most accurate for Seattle?
AirNow is the official reference because it relies on regulatory monitors and EPA's method. A corrected sensor map adds neighborhood detail and earlier warning. Checking both tells you more than either one can alone.
Why does my weather app AQI not match AirNow?
Many weather apps show a modeled estimate for a grid area instead of a reading from one monitor. Some still run older breakpoints, and Google's Universal AQI scores 100 as the best air. Check the scale and the source before you compare numbers.
Did Washington State use a different AQI scale?
Yes. Washington had its own Washington Air Quality Advisory, which flagged risk at lower particle levels than the federal AQI. The state moved to EPA's AQI by April 30, 2022, so any page still citing WAQA thresholds is out of date.
How often should I check Seattle's AQI during wildfire season?
Once a day covers you on steady days. When crews report wildfires anywhere upwind, check every few hours. During an active smoke event, look right before any outdoor activity, since readings can shift within an hour.
Read the Gap Between Seattle AQI Apps
You can now spot why Seattle AQI apps disagree in seconds, from the averaging window to the scale on the screen. Keep AirNow and a corrected sensor map side by side, check which pollutant sets each score, and you'll have exactly what you need to protect your family on the days the numbers split. For better indoor air protection, choose the right air filtration products from Filter USA.