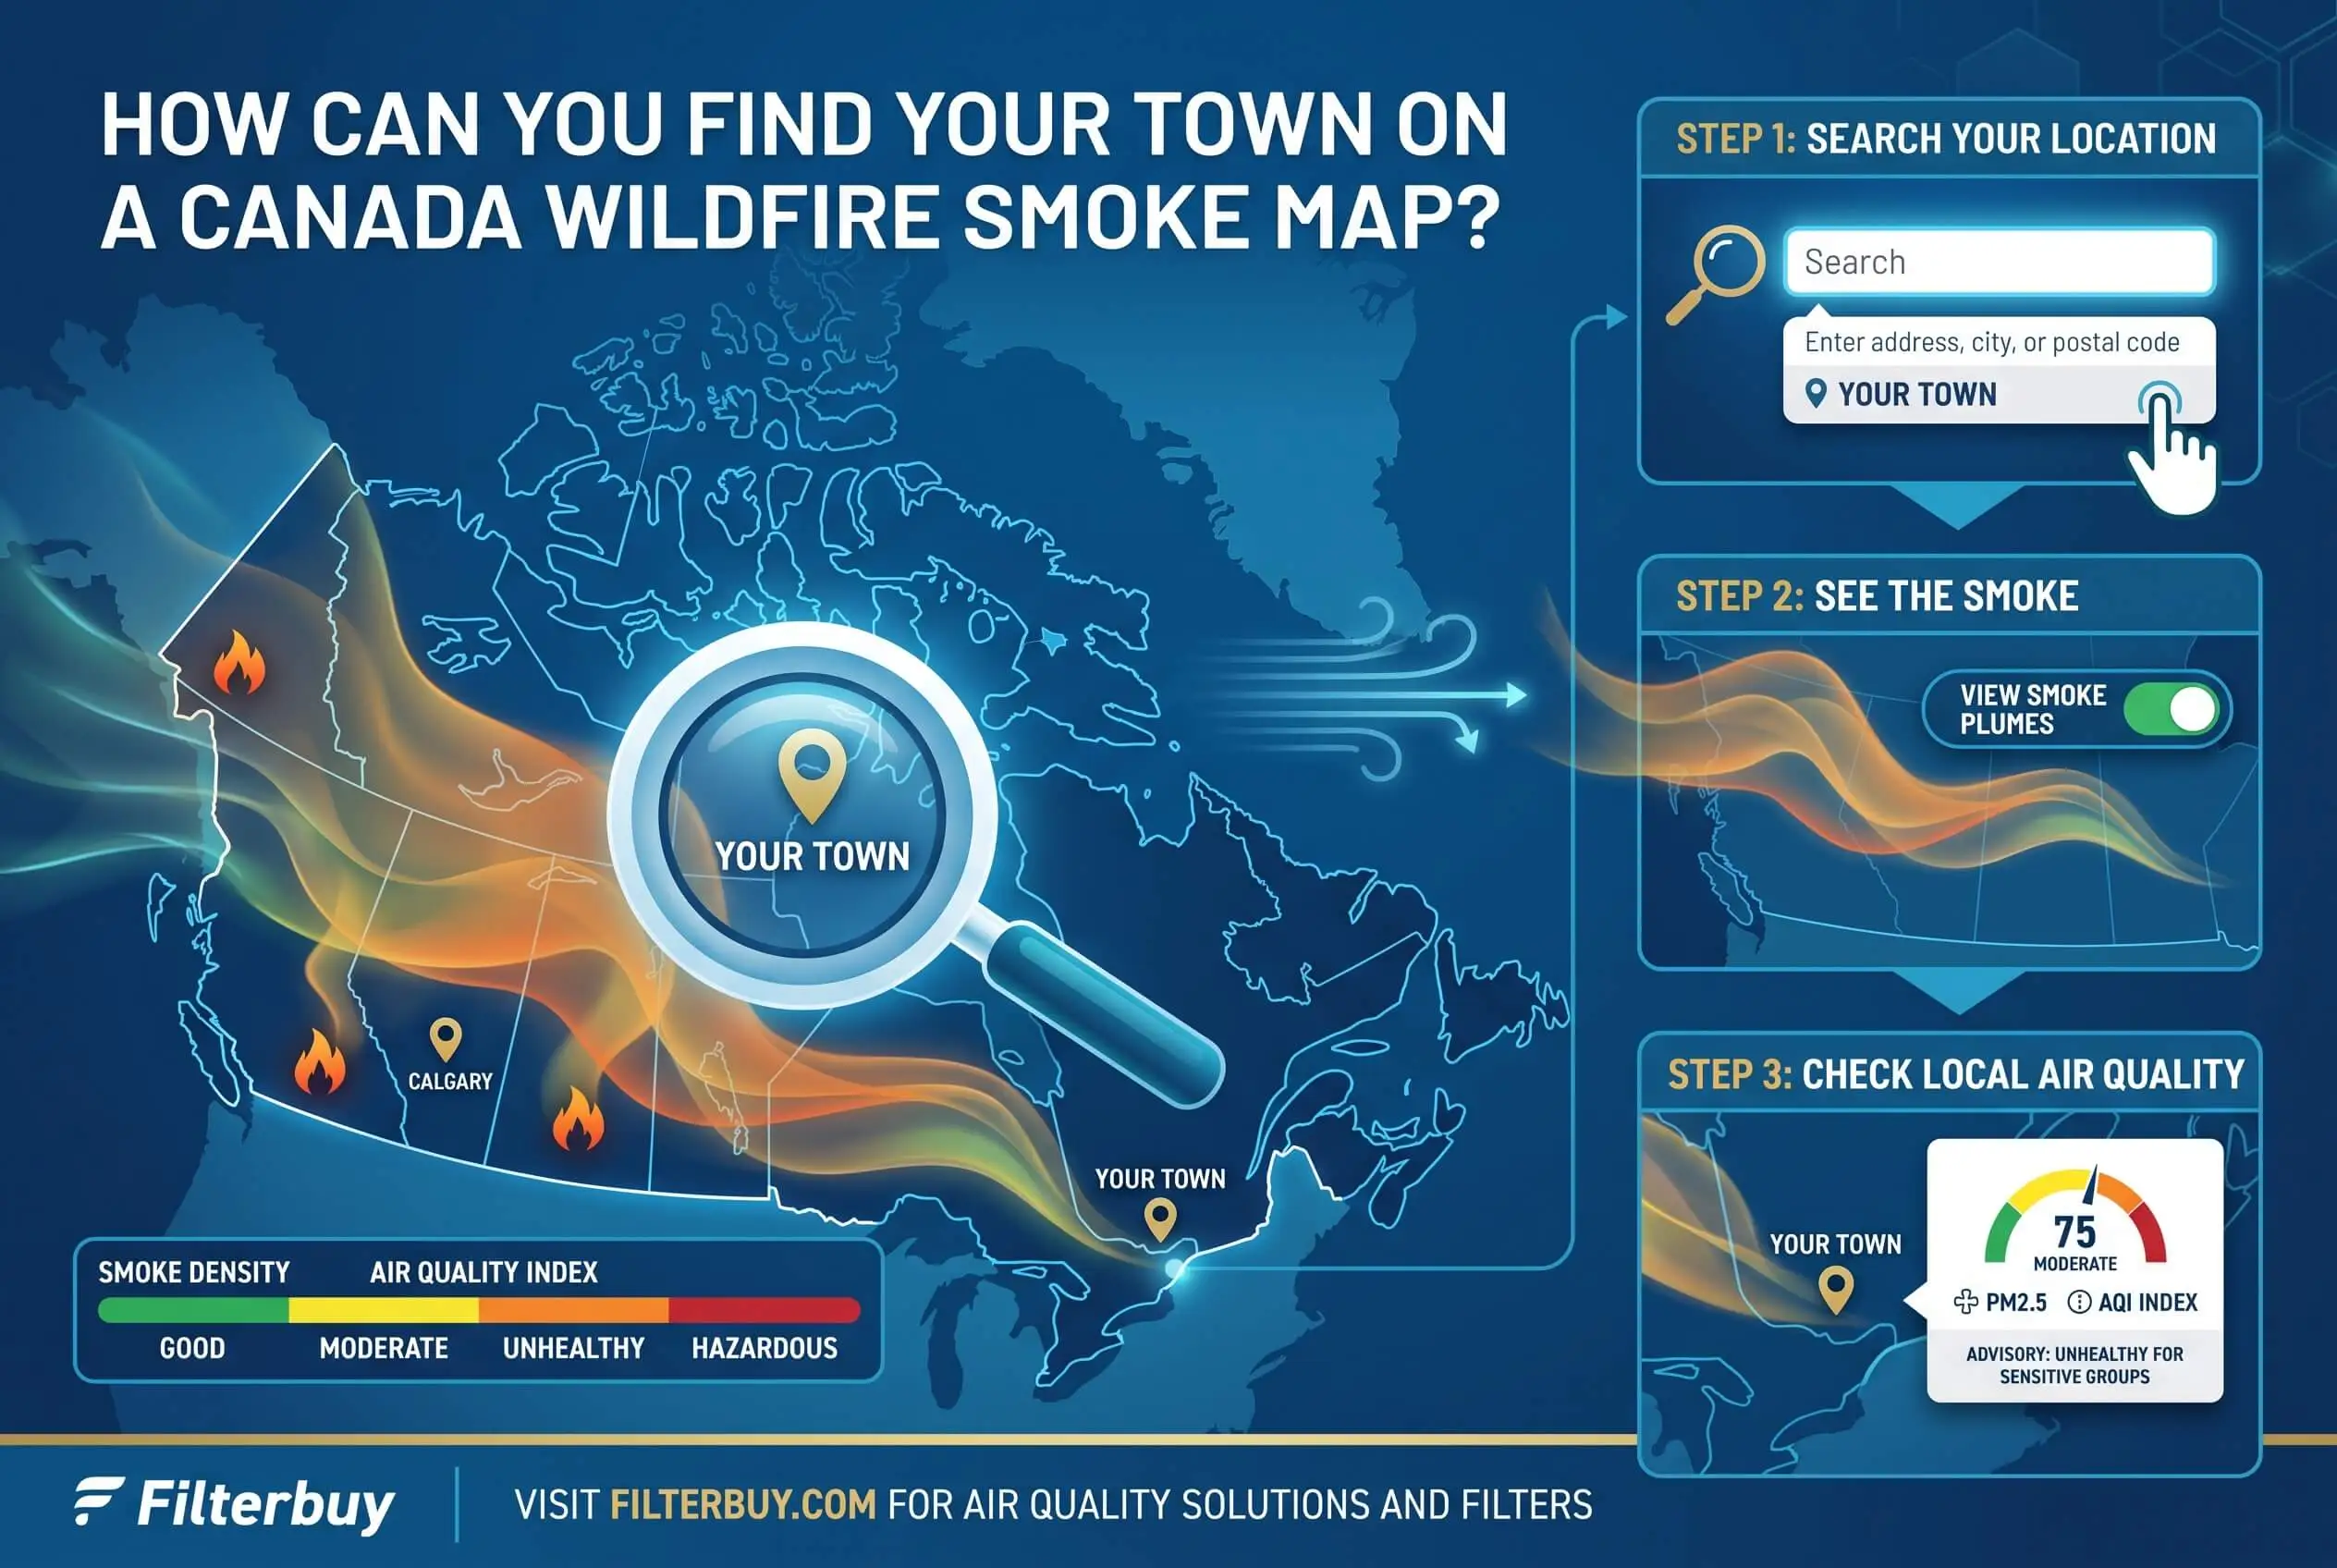
Switch the smoke layer on before you zoom in. That one move decides whether the map tells you something worth acting on or hands you a blank screen you will read as good news.
I found this out the slow way, hunting for my own town through a rough stretch of July and landing on empty grey where I live. Outside, the air smelled like somebody had left a campfire burning in the next yard. Wrong layer, right town. Getting from a national view down to a reading you can trust for one specific place takes about a minute, and it comes down almost entirely to the order you do things in. A Canada wildfires smoke map makes that process easier by giving you a clearer picture of where smoke is moving and helping you narrow your attention to the conditions that matter most in your area.
TL;DR Quick Answers
Canada Wildfires Smoke Map
A Canada wildfires smoke map stacks three separate feeds: satellite fire detections, modelled smoke plumes, and ground monitor readings. Turn the smoke layer on before you zoom, because the fire layer alone shows nothing unless a fire burns inside your frame. Blank does not mean clear.
Smoke layer first, zoom second. Fire detections and smoke plumes come from different systems, and only one of them tracks what is over your roof.
Step down through the scales. Province, then the nearest large city, then your town, so you can see where the plume edge sits relative to you.
A blank patch usually means no sensor. Two out of three Canadians live within 100 kilometres of the southern border, and the monitor network follows that population.
Read the issue time. Environment and Climate Change Canada publishes AQHI forecasts at 6:00 a.m. and 5:00 p.m. local time, and runs PM2.5 alone during smoke events.
Top Takeaways
Layer first, zoom second. A blank frame at town level usually means you have the wrong layer running, not that your air is clear.
Step down through the scales. Province, then the nearest big city, then your town, so you can see where the plume edge sits in relation to you.
No sensor is not the same as no smoke. Most of Canada sits outside the dense monitoring ribbon, and some communities get no published local value at all.
Read the issue time. ECCC publishes AQHI forecasts at 6:00 a.m. and 5:00 p.m. local time, and shifts the calculation to PM2.5 alone during smoke events.
Confirm the province. Duplicate town names and approximate satellite fire points are the two most common ways people end up reading somebody else’s air.
Start With the Layer, Not the Zoom
A Canada wildfire smoke map is really two or three maps stacked on top of each other, and a different system draws each one. Satellites pick up heat and plot it as fire detections, single points where an instrument caught something burning. Analysts and models draw the smoke layer separately, as polygons across the ground the plume has covered. Ground monitors generate the air quality readings, measuring what people standing at that spot are breathing right now.
The layer decides what you see. Drop into a town in Saskatchewan with the fire layer alone and the screen stays empty unless a fire happens to be burning inside that very frame, which it usually is not. The smoke over those rooftops came from a fire six hundred kilometres north. So turn the smoke layer on. Then zoom.
Zoom to Your Town in Three Moves
I step down through the scales instead of jumping straight in, and while that sounds like the slower route, it gets you there faster because you never lose your bearings.
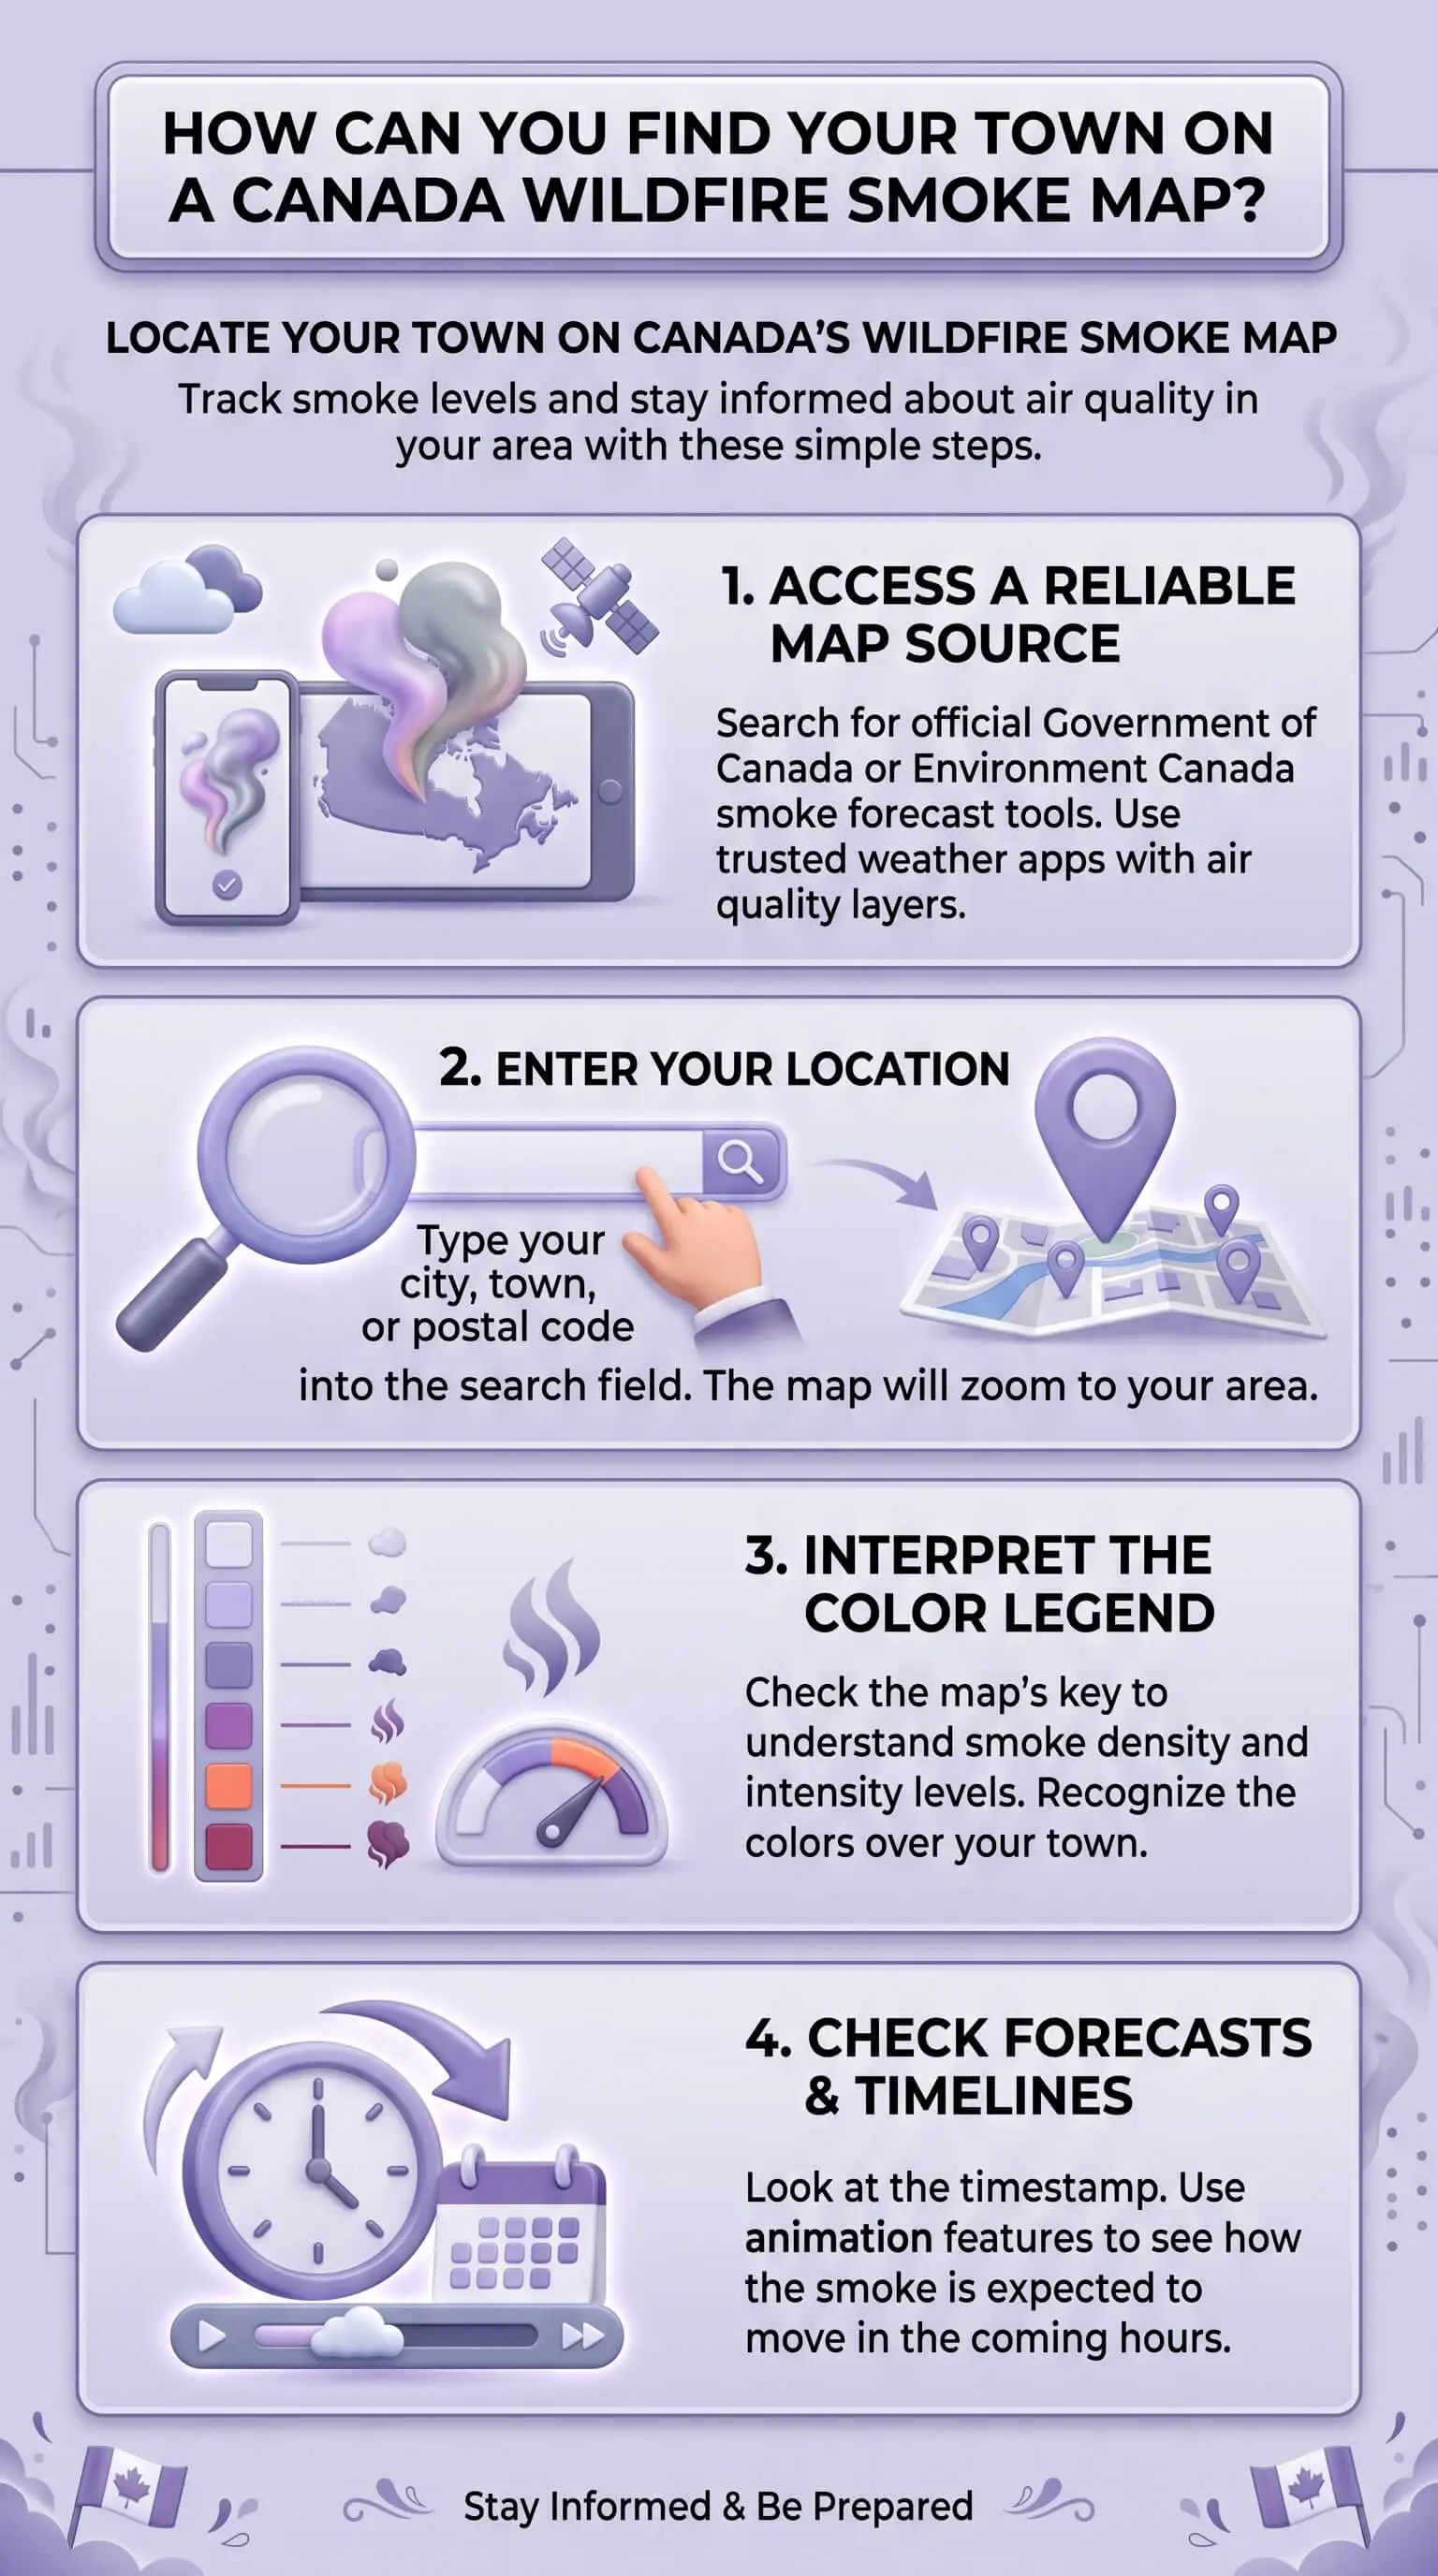
1. Zoom to your province or territory and look at where the smoke edge falls against the whole province before you go any further.
2. Zoom to the nearest large city you recognise by sight. Rivers, big lakes, and highway lines anchor you far better than town labels do.
3. Zoom to your own town from there.
Typing a name into a search box skips the part that does the work. Stepping down lets you watch the plume boundary travel across the frame, so you arrive already knowing whether your town sits near an edge or well inside the smoke. That single piece of context changes what the reading means.
Why Your Town Can Read Clear When the Air Is Not
Almost nobody explains this part, and it is the reason a clean-looking map talks households into leaving the windows open. Canada covers close to ten million square kilometres. The monitor network does not cover it evenly. Monitors sit where people sit, and in this country that means a narrow ribbon along the southern border.
Environment and Climate Change Canada states this plainly in its own documentation. ECCC builds most community values by averaging the local stations it has picked to represent that community, so your reading can differ from what any single station records. If you live outside an established AQHI community area, ECCC publishes no local value for you at all.
So read a blank patch carefully. Nine times out of ten it marks the absence of a sensor rather than the absence of smoke. For anyone living north of that populated ribbon, the modelled smoke layer deserves more of your trust than the dots do.
Make Sure You Are Looking at the Right Place
Two things quietly send people to the wrong pixel.
Duplicate place names. The provinces hold multiple Windsors, Springfields, and Riversides between them. Confirm the province before you trust anything on the screen. When I cannot tell, I look up the official spelling and province in the Canadian Geographical Names Database rather than taking the map label at face value.
Pixel offset on fire points. NOAA spells this out: a satellite fire detection marks the centre latitude and longitude of the pixel where the instrument caught heat, and the fire itself can sit somewhere else inside that pixel depending on the resolution of the sensor that found it. Hotspots are approximate. A dot that looks ten kilometres from town might not be ten kilometres from town.
Check the Timestamp Before You Decide Anything
Smoke layers are forecasts, and every forecast carries an issue time. Environment and Climate Change Canada publishes AQHI forecasts twice a day, at 6:00 a.m. and 5:00 p.m. local time. Look at seven in the morning, act on it at four in the afternoon, and you are working from a frame the weather has already overtaken.
There is a second reason to look twice. During a wildfire smoke event, ECCC changes how it calculates the index, dropping the usual three-pollutant blend and running PM2.5 alone on an hourly basis, because fine particulate is what smoke drives up fastest. The number can travel a long way inside one day. Afternoon convection and passing fronts move plumes just as quickly. I check once in the morning and again after three, while keeping top air filters in mind as an important part of managing indoor air when smoke conditions shift throughout the day.
What Changes Indoors Once You Have Found Your Town
Finding your town only counts for something if it changes what you do next. Once a live Canada wildfire and smoke map puts a plume over your area, you get to do the unglamorous work that protects the people in the house.
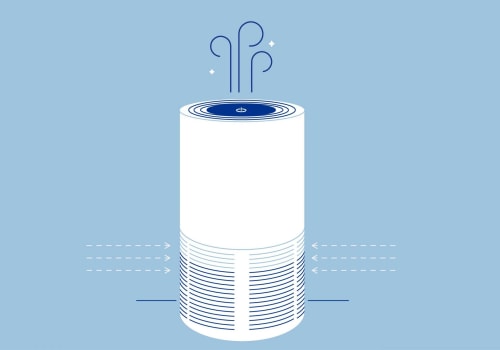
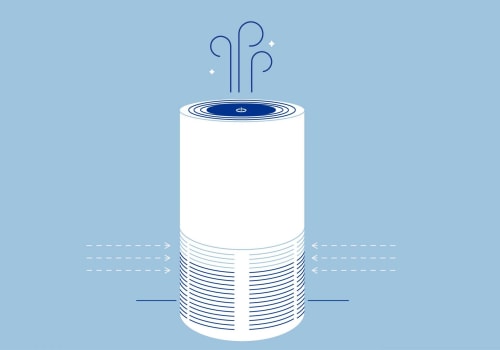
Shut the windows. Turn the fresh-air intake off, or set the system to recirculate, so your equipment stops pulling smoke indoors on purpose. Move the fan from Auto to On, which keeps indoor air cycling through the filter instead of only when the system happens to be heating or cooling. Run the highest MERV rating your equipment can carry while airflow stays normal. For most homes that land on MERV 13, the level is built to catch the fine particulate that makes up the bulk of smoke. Then pick one room where you actually spend your evenings, keep the door shut, and run a portable HEPA unit sized for that space.
One habit I picked up the hard way: check the filter far more often than your normal schedule tells you to. Smoke clogs pleated the media fast. Far faster than household dust does, and a matted filter chokes airflow at the exact moment you need air moving through it, which is also when indoor air quality testing can help you understand how well your indoor air is being protected.
"The mistake I run into most often is people reading a blank map as good news. Across a lot of this region there simply is no monitor inside fifty kilometres of a community, so what they are looking at is a missing sensor, not clean air. I tell people to trust the plume forecast over the dots, and to open a window when the forecast clears rather than when the map stops showing colour."
7 Essential Resources
1. Read Your Community Value and Its Three-Day Outlook in One Place
The national summary table lists current values and forecast maximums for Canadian communities, sorted by province, so you can find yours without hunting across a map first. Source: Environment and Climate Change Canada, Local Air Quality Health Index.
2. Learn What the Number Is Actually Measuring
This page walks through the 1 to 10+ scale, the health advice attached to each band, how ECCC builds community averages out of station data, and the switch to PM2.5-only calculation during smoke events. Source: Environment and Climate Change Canada, About the Air Quality Health Index.
3. Watch the Fires Themselves Move Day by Day
Canada’s national fire mapping system lets you toggle hotspots, season-to-date detections, active fires, and perimeter estimates, then step backward and forward one day at a time to see how a fire travelled. Source: Natural Resources Canada, Canadian Wildland Fire Information System interactive map.
4. Borrow the Dense Monitor Coverage Just South of You
Live in southern Ontario, the Prairies, or southern B.C. and this map fills gaps a Canada-only view leaves wide open, adding thousands of American monitors and low-cost sensors within reach of the border. Source: U.S. EPA and U.S. Forest Service, AirNow Fire and Smoke Map.
5. Find Out Who Draws the Smoke Shapes You Are Reading
The smoke polygons on most public maps start here, where analysts work from satellite imagery and sort plumes into light, medium, and heavy density. This page also documents why fire point coordinates stay approximate. Source: NOAA NESDIS, Hazard Mapping System Fire and Smoke Product.
6. Let the Map Come to You Instead of Checking It
Near real-time satellite fire detections for Canada and the United States, with email or text alerts whenever new detections land inside an area you draw yourself. This is the best available fix for remembering in June and forgetting by August. Source: NASA, Fire Information for Resource Management System, US and Canada.
7. Turn One Room Into Somewhere Your Family Can Breathe
Step-by-step instructions for setting up a single clean-air room, covering intake handling, filter rating, and how to size a portable unit without guessing. Source: U.S. EPA, Create a Clean Room to Protect Indoor Air Quality During a Wildfire.
These seven resources help you track local air quality, follow wildfire movement, understand smoke-map data, use cross-border monitoring, set alerts, and prepare a cleaner indoor space with HEPA air purifiers during wildfire smoke events.
3 Statistics
Two out of three Canadians live within 100 kilometres of the southern border. That ribbon holds roughly 4 percent of the country’s territory. Monitoring networks follow the people. The other 96 percent goes thinly covered. Source: Statistics Canada, 2016 Census.
Smoke turns up hundreds of miles from the fire that made it. Once inhaled, particulate moves deep into the lungs and then into the blood, which carries it to every organ. Your distance from a fire is not your distance from its smoke. Source: National Institutes of Health, NIH News in Health.
Wildfire smoke travels thousands of miles, and air stays polluted for days or weeks. One afternoon glance describes nothing. Plan on looking again through the whole event rather than settling for a single reading. Source: American Lung Association.
Wildfire smoke can travel thousands of miles and linger for days or weeks, which makes repeated air-quality checks important even far from the fire, while an HVAC air purifier ionizer can be part of a broader indoor air strategy during prolonged smoke events.
Final Thoughts and Opinion
After several fire seasons of doing this, here is where I have landed. A smoke map is a targeting tool, not a verdict. It tells you where to point your attention. It does not certify the air in your house.
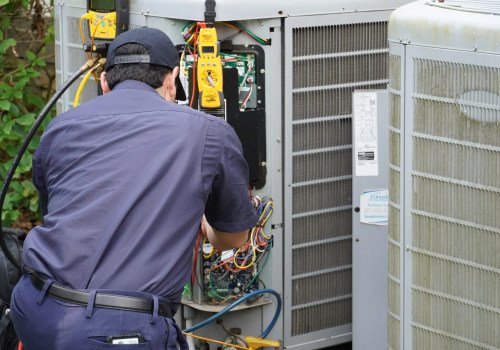
That leads me somewhere a few people find overcautious. When the modelled plume says smoke and the nearest monitor says fine, I go with the plume. That monitor might sit ninety kilometres away on the far side of a ridge, folded into a community average that has very little to do with my street. The plume forecast is coarse, but at least it covers where I am standing. Being wrong toward a closed window, a running fan, and timely HVAC system maintenance still leaves me with cleaner airflow and a system better prepared to handle smoky conditions. Being wrong the other way means my household spends a day breathing fine particulate while a reassuring number, measured somewhere else entirely, tells us everything is fine.
The honest caveat is that plume forecasts overpredict too. Some days they will have you sealed up and the sky turns out clear by noon. I can live with that trade. Somebody with a different tolerance could weigh it the other way and still be reasoning well.
Frequently Asked Questions
How often does the smoke layer update?
That depends which product you have open. Satellite fire detections arrive within a few hours of a satellite pass. NOAA analysts redraw the smoke polygons as fresh imagery comes in. ECCC publishes Canadian AQHI forecasts twice daily, at 6:00 a.m. and 5:00 p.m. local time, with hourly observed values between them.
Can I get an alert for my own town instead of checking the map?
Yes, and I would set one up. NASA’s FIRMS service emails or texts you when new fire detections appear inside an area you draw yourself, and the WeatherCAN app supports custom air quality notifications. Alerts solve the real problem, which is checking diligently in June and forgetting by August.
Does a clear monitor reading mean the air near me is safe?
Not by itself. ECCC typically averages several stations to produce a community value, so that number may not describe your street, and terrain holds or clears smoke over surprisingly short distances. When the modelled plume covers you and the monitor disagrees, treat the plume as the more relevant signal for where you live and consider using an air purifier indoors during the smoke event.
What if my town is not labelled on the map at all?
Work from geography rather than labels. Find a lake, a river bend, or a highway junction you know, then place yourself against it. If you want certainty, look your community and province up in the Canadian Geographical Names Database and match the coordinates on the map.
How far from a Canadian fire do I need to be to stop worrying?
There is no safe radius. Smoke from Canadian fires has degraded air quality thousands of miles downwind, and communities with no fire anywhere near them regularly see high levels of fine particulate. Proximity to flames is the wrong question. The position under the plume is the right one.
Do I need a different filter during smoke season?
Probably a higher-rated one, and definitely one you change more often. MERV 13 is the level most residential systems can run while still capturing fine smoke particulates, provided your airflow stays normal. During a long smoke event, look at high quality pleated furnace filters every week or two instead of every month.
Finding Your Town Takes About a Minute Once You Know the Order
Turn the smoke layer on, step down from your province to your town, and read the issue time before you decide anything. Then look at what is sitting over your roof and set your windows, your fan, and your MERV 8 pleated HVAC furnace air filters to match it.